What is a good Net Promoter Score?

Last updated on January 4, 2023
NPS is a very sought-after resource that many companies want to use when setting goals for their own NPS strategy. However, one must remember that you should not stare blindly at others’ NPS since there are other factors affecting the score itself.
In this article, we will share some good tips on how you should manage and utilize NPS benchmarks.
In This Article:
Net Promoter Score in a nutshell
NPS, or Net Promoter Score, is a market metric that is used in many industries because it is an easy way to quantify how loyal customers are. Recent findings show that NPS is one of the top 3 customer experience metrics used by CX programs. In a nutshell, the Net Promoter Score asks “how likely would you be to recommend” a product or service to others. It calculates the percentage of promoters, minus the percentage of detractors.

What is a good NPS?
NPS benchmarks can help businesses measure and compare customer loyalty across different industries, geographies, and time periods, enabling them to better understand the factors that drive customer enthusiasm and satisfaction.
Additionally, NPS benchmarks can be used to compare the performance of different product and service offerings within the same organization. By understanding how customer loyalty changes over time, companies can make data-driven decisions on where to invest resources in order to increase customer engagement and experience.
These benchmarks may show you signs of whether your business is doing well or needs improvement. Focusing on internal benchmarks is where you want to start looking.
The NPS benchmark you should aim for in your industry should be above average – that is how you can keep standards and results high. There are 2 ways in which these benchmarks are shown. These are:
- Global Benchmark (Absolute method) – As suggested by Reichheld, a standard NPS result can be:
-
- 0 which means good
- 20 means favorable
- 50 is excellent
- 80 is world-class
- Industry Benchmark (Relative method) – These benchmarks provide organizations with valuable insights into how they are performing relative to their competitors. By understanding the NPS of competing organizations, businesses can take steps to improve their own score and increase customer loyalty.
Generally, an industry benchmark will be determined by calculating the average of all competitors in a given sector, such as retail or banking. By looking at the average NPS across all industries, it is possible to understand how individual organizations are faring and identify areas that need improvement.
Furthermore, true industry leaders can be determined by examining NPS data, allowing businesses to strive for higher levels of customer satisfaction and loyalty.
In addition to providing a quantitative benchmark for organizations, NPS data can also reveal specific customer touchpoints that have been successful or unsuccessful in creating positive customer experiences. This information can then be used to fuel strategies for improving customer retention and increasing revenue through improving customer satisfaction.
Factors that affect your NPS
Despite the ease of understanding what a good NPS is, benchmarking can be complex. In fact, it can sometimes be misleading.
NPS measures the satisfaction level of your customers, not just the attitudes they hold towards your company. You can improve your product every day but what’s the point if your customers leave and remain unhappy? Surely, your promoters must stay as promoters. But, we can’t forget about the detractors.
Here’s an interesting fact. In a recent study, at least 49% of consumers are now saying that they are willing to talk about their positive experiences on social media compared to the 30% of those who will post something negative. A significant change since 2013 when it is the other way around. There were previously 45% of people sharing negative feedback on social media and only 32% sharing positive feedback.
Digging through the reasons for these changes can be from many factors such as digitalization, the rise of millennials, cancel culture, politics, etc. which only proves that trends keep changing and so does the opportunities and threats. But again, every customer satisfaction metric has several factors that influence the results. That is why you need to take note of the factors:
Customer zone of tolerance
Zone of tolerance has something to do with how much your customers interact with your business on a daily basis. It is not an NPS, but a result of your customer’s satisfaction that decreases whenever there is a service interruption.
You can ask yourself, on a scale of 0-10, How likely would your customer get angry in case there is a service interruption? that is, if you fail to address their issues immediately. There are two ways to categorize it.
- Low-tolerance industry and high-tolerance industry. Using a Likert scale of 0-10, Low-tolerance-industry are those industries that may get mostly a score of near 10 when asked how much negative reaction a business will get during an interruption. (e.g., Streaming services, telecommunication industry, etc.)
- High-tolerance-industry meanwhile is the opposite. A score of less than 4 means a business will less likely to receive negative feedback when an interruption happens. (e.g. retail industry)
On the other hand, just because your score falls in the high-tolerance industry doesn’t mean you should be complacent! Your score, however high or low it is, can change by how you provide a good customer experience. In a low-tolerance industry, Increasing the tolerance level by providing customer touch points is one small step to putting a smile on your customers.
Challenges in economic and current events
The recent pandemic has greatly influenced how consumers think and decide. Now more than ever, it is so much easier for any customer to turn their attention to something else after having just one bad customer experience.
Options are everywhere and grasping a positive customer experience like no other is getting harder; a great contributing factor affecting the trends in different industries. We can see through these changes because of the increasing demands in enhancing the business processes, digitalization, and ease in customer experiences.
The scores are shifting downwards. According to the data by Retently, they found that out of the 20 industries they looked into, banking, SaaS, and other online services got a more significant decline. Noticeably, the pandemic that shook big and small enterprises is one of the reasons that caused this decline. But we’re past that stage, and now, many businesses are focusing on recovery.
What can SMEs do? Adapt. There is no way that we can stop the changes around us. In fact, change is the only constant thing in life as many would say. Some industries, for example, had the chance to prepare and adapt before the pandemic hits and others even managed to gain good NPS results while there is an economic crisis resulting from this.
Scoring nature due to cultural and regional biases
An NPS result of a particular business may not necessarily suit a particular culture. For example, Europeans generally score a lower NPS than Americans. But why?
The reason for this has a lot to do with the “scoring nature” of different countries and cultures due to their backgrounds and differences in giving opinions.
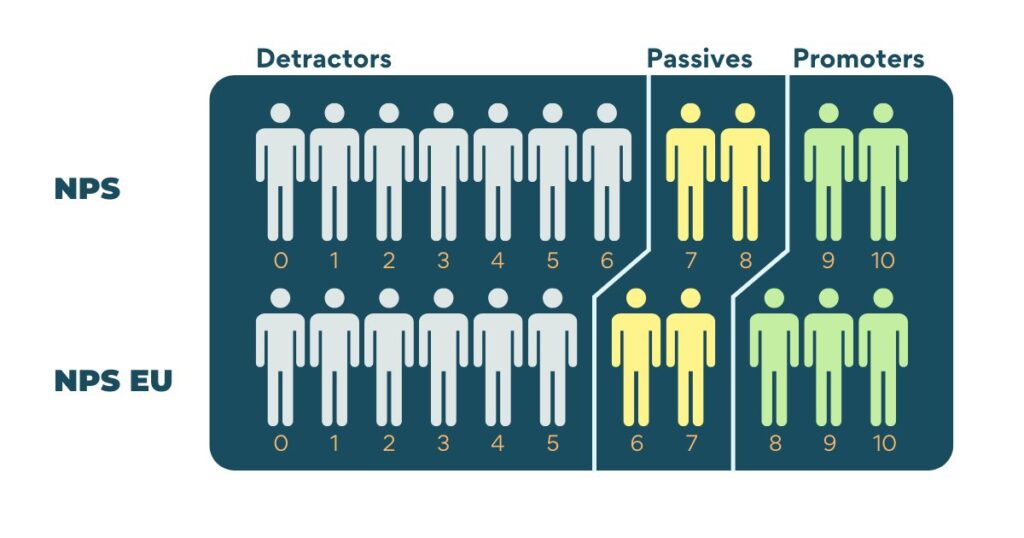
As compared with Europeans, Americans are more likely to give extreme answers when asked to rate something from 0 to 10. Something that is rooted in their culture such as the school grading system where a child is expected to have a grade of A’s (also means 10). Meanwhile, when Europeans get an 8 or sometimes even 6, it means it’s a very good score.

Many European businesses fall under neutral NPS scores. So, to leverage the classic scoring system, applying 8 as an addition to the promoters, and 6 as a passive will help in balancing the overall results. (Refer to the chart above)

The numbers alone can’t show you where you need to improve your score. That’s why platforms that focus on analyzing customer experience are one of the best ways to identify who are your promoters, who are your detractors, and what exactly are they saying
Take the Lumoa platform as an example. Most companies today use NPS, CSAT, online ratings, and other numbers to assess how happy their customers are. What they miss though is a way to tell what actions will move the numbers up or down. That’s why Lumoa looks at any interaction with your customers and tells you what to do next to grow your business.

In which industry does your business belong to?
Knowing how your internal NPS is one thing but knowing where you stand in the big picture is another.
Every NPS result has a benchmark by industry. Industry benchmarking is a good way to hit two birds with one stone. NPS benchmarks by industry are a good basis for businesses to challenge themselves for improvements as well as to know who and where their competitors stand. Additionally, it’s easier nowadays to gain insight into the industry NPS. They are mostly available on many Customer Experience Management (CEM) platforms and are open to the public.

How good is your score?
Bain & Company’s Loyalty practice creator Fred Reichheld suggests that any NPS above 0 is good. It means your customers are happy. Anything above 20 would mean it’s favorable. A score of 50 is “excellent”, and above 80 is considered world-class.
A score of 100 means that 100% of your customers are promoters, which is an unrealistic approach. It might seem like an ideal NPS, but you’re setting up yourself for the unreachable goal.
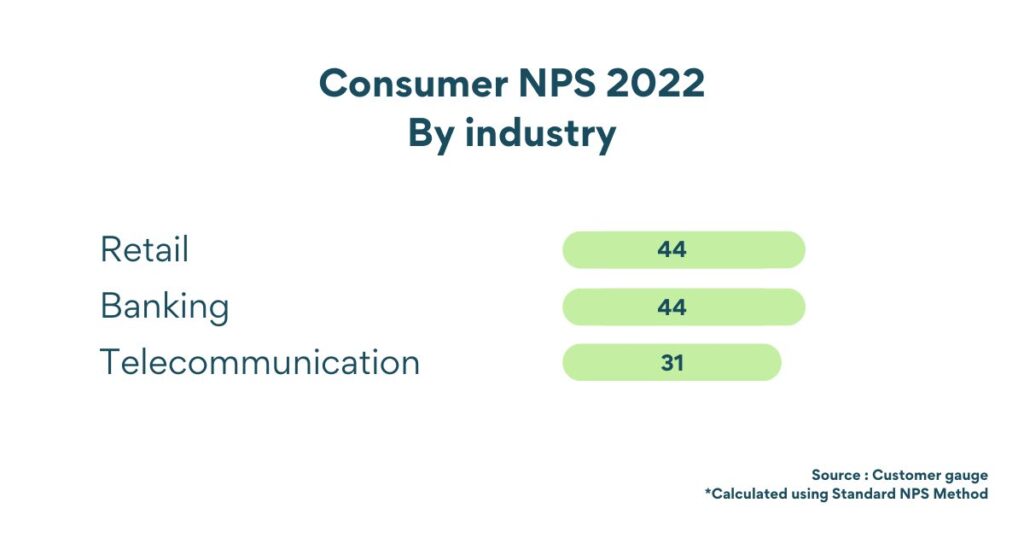
We already know how it’s calculated and what may affect the results of an NPS, so now, let’s look at how to analyze it. Take a look at the NPS in the retail industry and its 2022 benchmark as an example. The latest NPS benchmark for the retail industry shows that if Company X gets a score of 44 NPS above, it’s in the median level. This means people are happy about the business and its products or services. 25% of organizations that are at the bottom that get an NPS of 0 are doing ok but need improvement, while the other 25% that have 72 NPS or higher means they are doing well.

Because an NPS result can fall between -100 to 100, judging where you stand in global NPS standards (also known as the absolute method) and industry NPS Standards (or relative method) will give you a better insight into your overall NPS.
As per Reichheld, a score above 50 is an excellent NPS. However, these are all general guidelines. It is always advisable to look into industry-specific benchmarks.
Take note that getting the most recent data for your NPS would be better, but that doesn’t mean previous results are irrelevant. A comparison of previous NPS to the latest NPS is in fact, another way to know if your customers are happy and a good opportunity to challenge your business to develop further.
Is there a correlation between NPS and company growth?
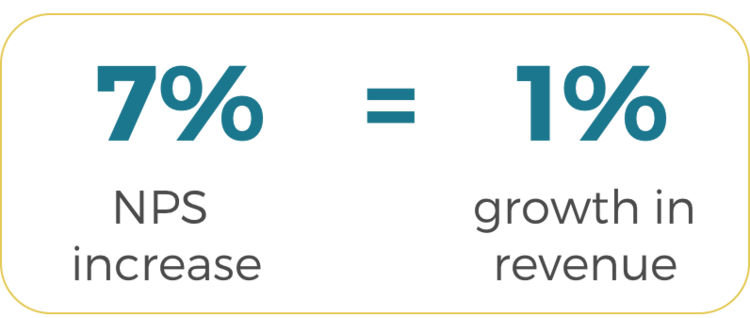
The short answer is, YES, it does! According to a study published by the London School of Economics entitled “Advocacy Drives Growth”, an average NPS increase of 7% correlates on average with a 1% growth in revenue. So yes, it has a great correlation to the growth of a business and is a great reason to think about how to increase your NPS!

However, influencing your current NPS is hardly possible without a bigger picture.
How to Increase your NPS Score?

So how do you increase your NPS score? There are numerous ways to increase your NPS and some of them are already mentioned above but most of all, it starts internally.
Define your goals and aim higher
The goal of improving your NPS should be part of your business objectives, and everyone in the organization should be on board with this. In addition, anything that enhances the customer experience, no matter how small, will help raise the score.
Challenge your performance by aiming higher than the previous results. The beauty of the Net Promoter system is that you can compare the scores, see the progress throughout time, and evaluate your efforts towards the NPS goal.
Listen to the voice-of-customer
How often does your business respond to voice-of-customer and close the loop?
It is important to know what they think about your products or services and resolve the issue as soon as possible. Moreover, it’s a good practice to ask for feedback from the right audience, at the right time, and at the right touch point.
Make them feel that they are an important part of how your business grows. Take proactive steps to improve your products and services, including training your employees so that they can give better customer service.
Remember!
When analyzing the NPS result, remember that NPS is more than just a score. Missing the open response part leaves a business without deep insights into what drives your customer experience up or down.
Analyzing NPS as a whole will bring you to understanding what your customers love and hate about the business, what they see as competitive advantages, and which direction you should move forward.

